Introducing Metrics Collection and Visualization in BigFix 11.0.4
Introduction
Starting with version 11.0.4, the BigFix Platform introduces a powerful new capability: the ability to collect and expose operational metrics. This enhancement offers improved visibility into Relay behavior as deployments grow, leading to more efficient and healthier Relays and potentially reduced costs for your BigFix environment. This can help optimize your BigFix infrastructure and potentially lead to savings.
By leveraging industry-standard tools like Prometheus and Grafana, BigFix now integrates seamlessly into modern observability ecosystems. This blog post will explore the new metrics functionality, its integration with Prometheus and Grafana, and the specific metrics exposed by the BigFix Relay.
State of the Art: Observability in Modern IT Environments
In today’s IT landscape, observability is a cornerstone of effective system management. Metrics, logs, and traces form the foundation of observability, enabling teams to monitor system health, detect anomalies, and optimize performance. Prometheus and Grafana have emerged as leading open-source tools in this space:
- Prometheus: A robust monitoring and alerting platform that collects and stores metrics as time-series data.
- Grafana: A powerful visualization tool that allows users to create interactive dashboards and analyze metrics data.
Generic Use Cases for Observability
- Application Performance Monitoring: Observability tools like Prometheus and Grafana can be used to track application performance metrics such as response times, error rates, and resource usage. For example, monitoring the latency of API endpoints can help identify slow-performing services, enabling teams to optimize code or scale infrastructure as needed.
- Infrastructure Health Monitoring: Observability platforms allow teams to monitor the health of servers, containers, and network devices. Metrics such as CPU usage, memory consumption, and disk I/O can be visualized in real-time, helping administrators detect hardware failures or resource exhaustion before they impact end users.
Metrics Collection in BigFix 11.0.4
BigFix 11.0.4 embraces tools like Prometheus and Grafana by exposing metrics in a format compatible with Prometheus, making it easier than ever to integrate BigFix into your observability workflows.
BigFix Relay: Exposing Metrics
The BigFix Relay is the first component to support metrics collection in version 11.0.4. It exposes metrics related to its HTTP server operations via a new REST API endpoint: /metrics. The exposed data adheres to the OpenMetrics (docs) standard and is formatted in a way that Prometheus can natively consume.
Integration with Prometheus and Grafana
The integration process is straightforward:
- Prometheus collects metrics from the BigFix Relay by querying the /metrics endpoint.
- The collected data is stored as time-series data in Prometheus.
- Grafana connects to Prometheus to visualize the metrics through customizable dashboards.
This architecture enables real-time monitoring and analysis of BigFix Relay performance, as illustrated in the following diagram:

Metric Types Explained
The metrics types used right now are:
- Counter: A cumulative metric that increases over time, such as the number of handled requests.
- Gauge: A metric that represents a value at a specific point in time, such as the number of active connections.
- Histogram: A metric that samples observations and counts them in configurable buckets, providing insights into distribution and latency.
BigFix Relay Metrics Overview
The BigFix Relay exposes the following metrics related to its HTTP server operations:
|
Metric Name |
Type |
Description |
|---|---|---|
|
bigfix_http_server_handled_requests |
Counter |
Tracks the total number of HTTP requests successfully handled by the BigFix Relay's HTTP server. Provides insights into the overall workload and request volume processed over time. |
|
bigfix_http_server_accepted_sockets |
Counter |
Counts the total number of sockets accepted by the HTTP server. Helps monitor the server's ability to establish connections and can indicate trends in incoming traffic. |
|
bigfix_http_server_active_connections |
Gauge |
Represents the current number of active connections to the HTTP server. Provides a real-time view of connection usage, which can help identify spikes in activity or potential bottlenecks. |
|
bigfix_http_server_request_parsing_time |
Histogram |
Measures the time taken by the HTTP server to accept and parse incoming request parameters. The data is aggregated into buckets, allowing administrators to analyze request parsing latency and identify performance issues. |
|
bigfix_http_server_handlers_processing_time |
Histogram |
Tracks the time spent by the HTTP server to process requests on specific routes. By aggregating the data into buckets, it provides insights into the distribution of processing times, helping to pinpoint slow or resource-intensive routes. |
|
bigfix_relay_active_persistent_connections |
Gauge |
Indicates the number of currently active persistent connections in the BigFix Relay. Persistent connections are long-lived connections that can improve performance by reducing the overhead of establishing new connections. Monitoring this metric helps ensure the Relay is handling persistent connections in the correct way. |
Total Response Time Explained
The total response time of an HTTP request handled by the BigFix HTTP Server can be approximated as the sum of the time spent parsing the request parameters (measured with the bigfix_http_server_request_parsing_time metric) and the processing time of the requested handler (measured with the bigfix_http_server_handlers_processing_time metric), as described in the following diagram:

Benefits of Metrics Collection
The new metrics functionality in BigFix 11.0.4 offers several key benefits:
- Enhanced Monitoring: Gain real-time visibility into the performance of BigFix Relay components.
- Proactive Troubleshooting: Identify and address issues before they impact end users.
- Data-Driven Optimization: Use metrics to fine-tune system configurations and improve efficiency.
- Seamless Integration: Leverage existing Prometheus and Grafana setups to monitor BigFix alongside other systems.
- Cost Savings: Optimizing system performance and proactively resolving issues can lead to reduced operational costs and prevent potential downtime expenses.
Use Cases for Observability in BigFix
- Proactive Issue Detection: By monitoring metrics such as bigfix_http_server_active_connections and bigfix_http_server_request_parsing_time, administrators can identify unusual spikes in activity or latency. For example, a sudden increase in active connections might indicate a potential overload or a misconfigured client.
- Performance Optimization: Metrics like bigfix_http_server_handlers_processing_time provide insights into the performance of specific routes. By analyzing this data, teams can identify bottlenecks.
- Capacity Planning: Gauging trends in metrics such as bigfix_http_server_handled_requests and bigfix_http_server_accepted_sockets helps administrators predict future workload demands. This enables better planning for infrastructure scaling and resource allocation.
- Troubleshooting Persistent Connections: The bigfix_relay_active_persistent_connections metric allows teams to monitor the efficiency of persistent connections. If the number of active persistent connections drops unexpectedly, it could signal issues with client configurations or network stability.
By leveraging these use cases, organizations can maximize the value of BigFix’s new metrics capabilities, ensuring a more resilient and efficient IT environment.
Getting Started
To start using the new metrics functionality:
- Upgrade your BigFix environment to version 11.0.4.
- Configure Prometheus to scrape metrics from the BigFix Relay’s /metrics endpoint.
- Set up Grafana to visualize the collected metrics using Prometheus as a data source.
- Explore the exposed metrics and create dashboards tailored to your needs.
Prometheus
To use the exposed metrics, a Prometheus server installation and configuration is required. Instructions are available at: https://prometheus.io/docs/introduction/overview/
Example Configurations
As an example, to monitor two Relays with IP addresses 10.0.0.1 and 10.0.0.2, the following minimal configuration can be added to the Prometheus configuration file (prometheus.yml):
|
scrape_configs: - job_name: "Relay2" |
This configuration will result in metrics being exposed by Prometheus with labels like:
|
metric_name{instance="10.0.0.1:52311", job="Relay1"} |
allowing to select or filter Relays using either the job or instance label.
This approach requires adding one job_name element for each Relay to monitor. Moreover, if Prometheus exporters are installed on the same machine where a Relay is running, it might be necessary to create more job definitions with similar values for job_name (e.g., “Relay1 exporter”, “Relay2 exporter”, etc.).
Alternatively, a more compact configuration can group Relays into a single job. The following example configuration uses also relabeling to define a new label (host) containing only the IP address or hostname (without the port number) for improved readability (compared to the instance label):
|
scrape_configs: |
This configuration will result in metrics being exposed by Prometheus with labels like:
|
metric_name{instance="10.0.0.1:52311", job="Relays", host="10.0.0.1"} |
allowing to select or filter Relays using the host label.
This approach requires adding one entry (“<hostname or IP address>:52311”) into the ‘targets’ array for each Relay to monitor. The same approach could be used to group together under the same job definition any additional Prometheus exporters running alongside the Relays e.g.,
|
scrape_configs: |
Infrastructure Monitoring
Prometheus provides an extensive selection of exporters for monitoring both infrastructure components, including hardware and operating system metrics, and additional software, such as databases, where BigFix modules are deployed. A comprehensive list is available at https://prometheus.io/docs/instrumenting/exporters/.
For instance, to monitor Linux and Windows metrics, the following exporters can be installed:
The Windows exporter can be configured to monitor the metrics of a specific process by enabling the Process Collector, as detailed at https://github.com/prometheus-community/windows_exporter/blob/master/docs/collector.process.md.
On Linux, the collection of per-process metrics necessitates the installation and configuration of an additional exporter, as found at https://github.com/ncabatoff/process-exporter.
Infrastructure monitoring's role in managing and optimizing a BigFix deployment will be discussed with examples in a subsequent article.
Grafana
Grafana, offered as both a hosted service and an open-source, standalone application, can be configured to use Prometheus as a data source. Instructions for installation and setup are available at https://grafana.com/docs/grafana/latest/getting-started/.
By leveraging the aforementioned metrics, users can construct diverse visualizations through the creation of specific queries utilizing the PromQL query language, as detailed here: https://prometheus.io/docs/prometheus/latest/querying/basics/.
As an example, to visualize time series data representing the average Request Parsing time, Handlers Processing time, and their combined value, the following three queries can be employed:
- Average Request Parsing Time:
|
sum by(host) (rate(bigfix_http_server_request_parsing_time_sum{job="Relays", host=~"$host"}[$__rate_interval])) / sum by(host) (rate(bigfix_http_server_request_parsing_time_count{job="Relays", host=~"$host"}[$__rate_interval])) |
- Average Handlers Processing Time:
|
sum by(host) (rate(bigfix_http_server_handlers_processing_time_sum{job="Relays", host=~"$host"}[$__rate_interval])) / sum by(host) (rate(bigfix_http_server_handlers_processing_time_count{job="Relays", host=~"$host"}[$__rate_interval])) |
- Average of Request Parsing Time + Handlers Processing Time:
|
( |
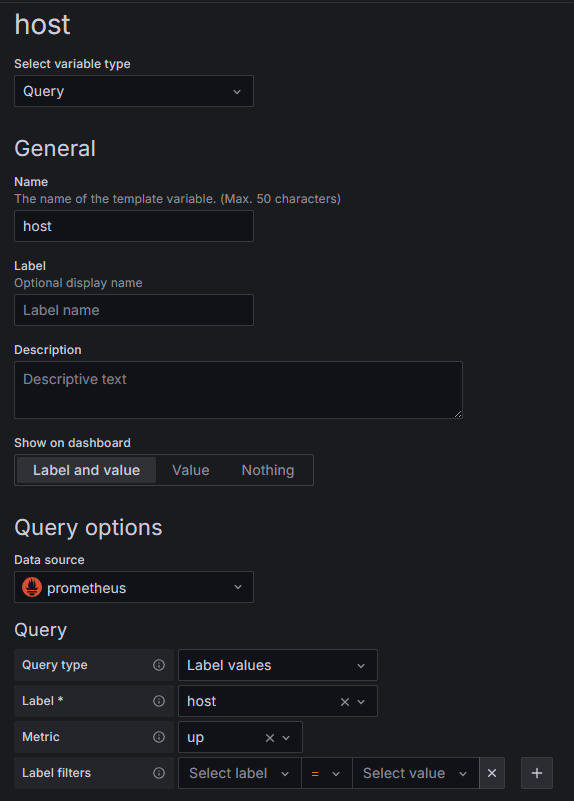
The three queries employ filters based on the job and host labels, the latter defined through relabeling as illustrated in the example within the Example Configurations section.
The host label filter employs a variable, also called "host", which can be configured within the dashboard settings as in the following screenshot.
Adding queries A, B, and C to a time series panel should produce results similar to the following.

Histogram type metrics can be used to calculate quantiles by means of the histogram_quantile() function.
For example, to determine the median Request Parsing time, the following query can be used:
|
histogram_quantile(0.5, sum by(job, host, le) (rate(bigfix_http_server_request_parsing_time_bucket{job="Relays", host=~"$host"}[$__rate_interval]))) |
The quantile value can be parametrized by defining a custom variable (named “quantile” in the following example):
|
histogram_quantile($quantile, sum by(job, host, le) (rate(bigfix_http_server_request_parsing_time_bucket{job="Relays", host=~"$host"}[$__rate_interval]))) |
These queries can be used to visualize how values are distributed with respect to the average, as in the following example:

The “quantile” variable in the example is set to 0.99, representing the 99th percentile. Query A is used to calculate the average time.
Grafana offers a feature to set thresholds, allowing for visual representation of query results in relation to defined acceptable or expected ranges, as illustrated in the following example:

The dashboard section above utilizes these two queries, which are expected to consistently produce identical values:
|
rate(bigfix_http_server_accepted_sockets_count{job="Relays", host=~"$host"}[$__rate_interval]) |
|
rate(bigfix_http_server_handled_requests_count{job="Relays", host=~"$host"}[$__rate_interval]) |
Conclusion
The introduction of metrics collection and visualization in BigFix 11.0.4 marks a significant step forward in observability for BigFix environments. By integrating with Prometheus and Grafana, BigFix empowers administrators to monitor, analyze, and optimize their systems with ease. Upgrade today to unlock the full potential of this new functionality and take your BigFix deployment to the next level.
~~~~~~~~~~~~~~~~~~~~~~~~~~~~~~~~~~~~~~~~~~~~~~~~~~~~~~~~~~~~~~~~~~~~~
Authors
Paolo Cavazza is a lead software engineer and BigFix performance tester.
Gaetano Fichera is a senior software engineer and a BigFix Platform developer.